What Is Pilot Scale Bioprocessing?
Pilot scale bioprocessing is the practical bridge between laboratory research and commercial manufacturing. It tests whether a promising process can remain stable when volumes increase. A flask may behave perfectly at two litres. A pilot bioreactor can reveal different realities.
Mixing changes. Oxygen transfer slows. Heat removal becomes less predictable. Even sampling can affect results. These details matter because cells respond to their environment, not merely to written instructions. During a pilot run, engineers monitor dissolved oxygen, pH, temperature, agitation, nutrient addition, and contamination risks. Stainless-steel vessels, tubing, filters, and harvest equipment must work together.
James M. Doran, author of Bioprocess Engineering Principles, has expressed the central challenge clearly: “Scale-up is not simply a matter of increasing volume.” That idea guides responsible development. The aim is not to copy every laboratory setting exactly. The aim is to preserve the biological conditions that control product quality and yield.
That sounds straightforward.
It is not always.
A pilot-scale batch may produce useful data, yet still expose weak assumptions. Maybe the feeding strategy is too sensitive. Perhaps the mixing time was underestimated. These findings are not failures. They are evidence, although interpretation requires discipline and experience.
In this article, we examine what pilot scale bioprocessing involves, why it supports process validation, and how teams manage technical uncertainty. We will also consider equipment selection, scale-up criteria, documentation, and comparability. The process may look orderly from outside. Inside the vessel, biology remains wonderfully inconvenient.
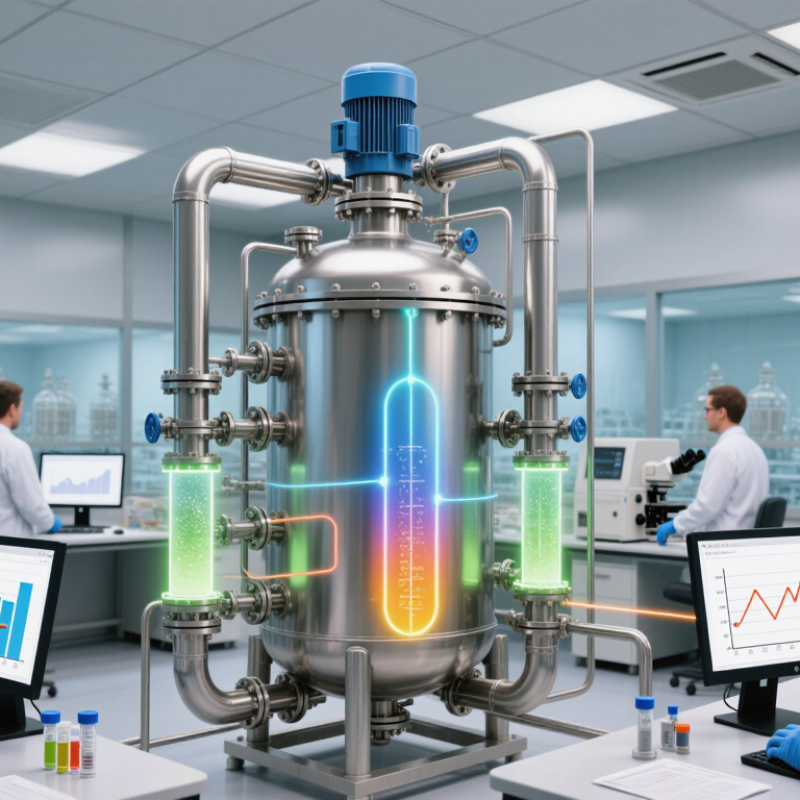
Defining Pilot Scale: From 2–10 L Research Reactors to 100–1,000 L Systems
What Is Pilot Scale Bioprocessing?
Defining Pilot Scale: From 2–10 L Research Reactors to 100–1,000 L Systems
Pilot scale bioprocessing connects laboratory studies with larger manufacturing operations. A 2–10 L reactor often supports process development, media testing, and early parameter screening. At this volume, teams can examine cell growth, product formation, oxygen demand, mixing, and pH control with manageable material use. These reactors are small, but they reveal important process weaknesses.
Moving toward 100–1,000 L systems changes the engineering challenge. Vessel geometry, heat removal, gas transfer, agitation, and sampling behavior may shift considerably. A recipe that performs well at 5 L may not behave similarly at 500 L. The transition is rarely neat. Teams should compare trends, not only final yields. They should also document unexpected foam, slow temperature recovery, or uneven feed distribution. Those details often predict larger-scale problems.
Tips: Define scale-up criteria before the first pilot run. Track oxygen transfer, mixing time, shear exposure, and culture health across each volume. Use comparable sensors and sampling methods where possible. Keep enough material for repeat testing; one pilot run may not explain every result. Review deviations openly, because a small inconsistency can expose an overlooked assumption. A 100 L system is not simply a bigger 10 L reactor. It is a different operating environment that demands measured evidence and careful interpretation.
Pilot-Scale Bioprocessing: Representative Reactor Volumes
Pilot-scale bioprocessing bridges laboratory development and manufacturing. Research reactors commonly span 2–10 L, while pilot systems typically operate from approximately 100–1,000 L to evaluate scale-up, process control, mixing, oxygen transfer, and product consistency.
Selecting Single-Use or Stainless-Steel Bioreactors at 10–1,000 L Capacity
What Is Pilot Scale Bioprocessing?
Pilot-scale bioprocessing bridges laboratory experiments and commercial manufacturing. At 10–1,000 liters, teams test mixing, oxygen transfer, feeding, harvesting, and cleaning under realistic constraints. The vessel is no longer a benchtop model. It becomes an operational decision.
Single-use bioreactors can reduce setup time and cleaning-validation activities. They suit frequent product changes, limited utilities, and uncertain demand. BioPlan Associates’ 2024 Annual Report surveyed more than 400 bioprocessing professionals. It documented continued reliance on single-use technologies across development and manufacturing, although adoption varies by process and scale. That caveat matters. Film integrity, extractables, waste volume, and supply continuity require documented controls.
Stainless-steel bioreactors require greater capital investment and reliable water, steam, and cleaning systems. They can support repeated campaigns, high utilization, and established cleaning strategies. ISPE’s Baseline Guide for biopharmaceutical facilities emphasizes that equipment selection must reflect process requirements, facility design, and lifecycle costs. At 1,000 liters, infrastructure often outweighs vessel price. At 10 liters, flexibility may matter more than durability.
Operators should compare batch frequency, changeover time, contamination risk, waste handling, and future expansion. A spreadsheet can miss the practical friction of hoses, sensors, and floor space. The best decision is rarely obvious. A technically elegant platform can still fail when people, suppliers, or waste systems are overlooked.
Scaling with kLa, P/V, Tip Speed, pH, and Dissolved Oxygen Above 30%
Pilot-scale bioprocessing connects laboratory findings with production reality. It tests whether cells, media, sensors, and control strategies remain reliable in larger vessels. The equipment is bigger, but the biology is not automatically stronger. Small changes can become serious problems.
Scale-up often begins with kLa, the volumetric oxygen transfer coefficient. A higher kLa can support oxygen demand, but excessive agitation may damage sensitive cells. P/V, or power per volume, helps compare mixing energy between vessels. Tip speed adds another practical limit because impellers can create shear near the blades. I usually review both values together. One number rarely explains the whole process. A dissolved oxygen target above 30% saturation may protect aerobic cultures, but it is not a universal rule. Cell type, viscosity, and oxygen demand still matter. pH control also deserves close attention. Small shifts can change growth, metabolism, and product quality within minutes.
Tips: Record agitation, airflow, kLa, P/V, tip speed, pH, and dissolved oxygen during each run. Check sensor calibration before inoculation. Watch for foam, slow mixing, and delayed pH responses. A clean trend often reveals more than one final result. Do not copy laboratory settings blindly. I have seen apparently successful scale-ups fail because the oxygen probe responded too slowly. That mistake was avoidable. Pilot work should challenge assumptions, not simply confirm them.
Validating Pilot Runs with Three Batches, Mass Balances, and CQAs
What Is Pilot Scale Bioprocessing?
Pilot scale bioprocessing tests whether a laboratory process can survive larger volumes, longer runs, and tighter operational demands. It exposes practical weaknesses early. Agitation, oxygen transfer, harvest timing, and sampling plans may change during scale-up. These changes can shift critical quality attributes, or CQAs, such as potency, purity, identity, and impurity levels.
A credible pilot validation normally uses three consecutive batches under defined operating conditions. The FDA Process Validation guidance describes process qualification and continued process verification as linked activities, not isolated tests. Three batches are common evidence, but they are not a universal rule. Risk, process complexity, and prior knowledge still matter. The 2024 BioPlan industry survey also identifies process consistency and manufacturing capacity as continuing concerns for biomanufacturers.
Mass balance checks make the run easier to trust. Teams should reconcile input materials, recovered product, waste, samples, and hold-up volume. For example, a 100-liter feed should not quietly become 82 liters without an explained loss. Each batch should compare yield, concentration, recovery, and loss points. CQA trends should be reviewed beside operating data, not afterward. A useful review may reveal an unexpected filtration loss or a sampling error. That is uncomfortable. It is also valuable. The process may pass three batches and still need a stronger control strategy.
What Is Pilot Scale Bioprocessing? — Validating Pilot Runs with Three Batches, Mass Balances, and CQAs
Illustrative three-batch pilot validation dataset for a 1,000 L microbial fed-batch process. Values are scientifically plausible planning and assessment data; acceptance criteria should be confirmed in the approved validation protocol.